
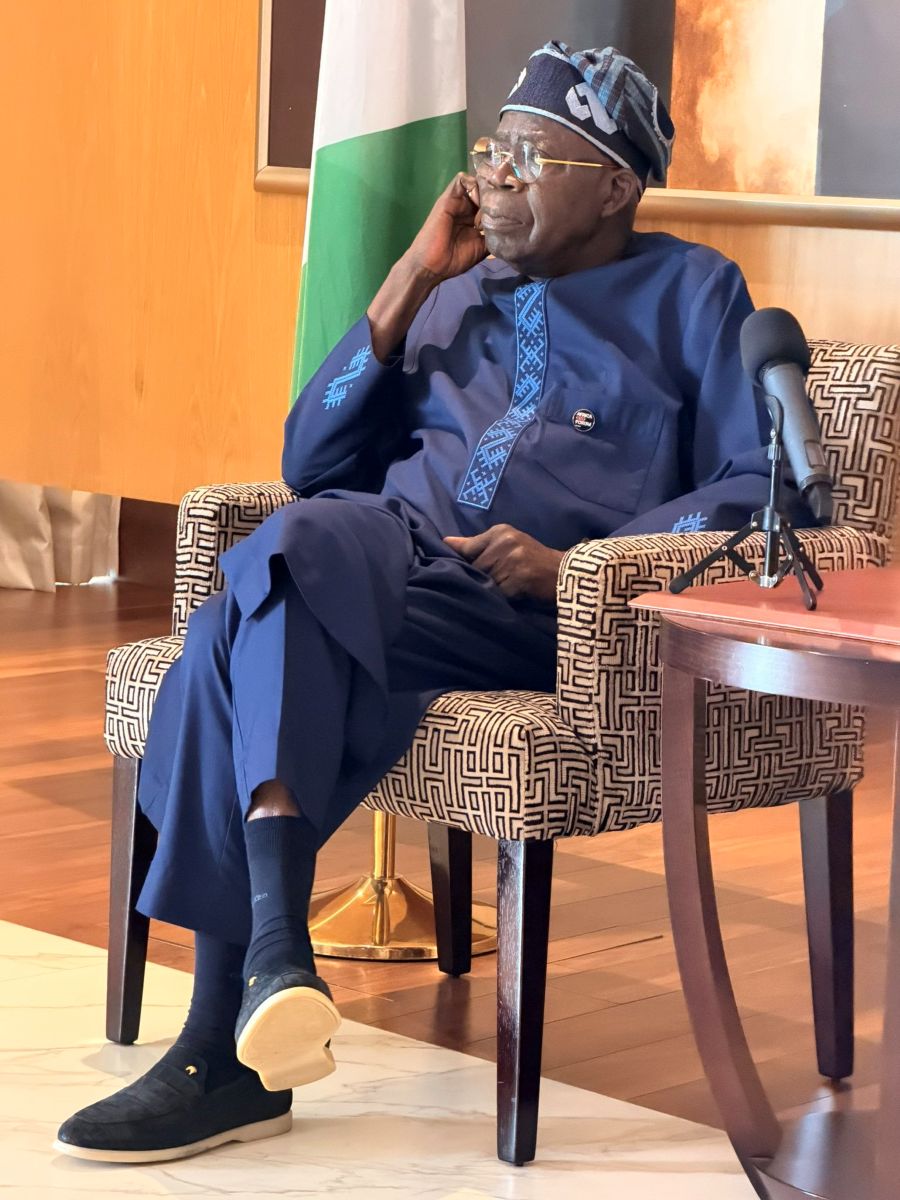

…With the campaign season now opening, the contest will increasingly be over not just whether these reforms changed Nigeria’s finances, but whether voters believe the gains have reached their households
WED AUG 19 2026-theGBJournal| As Nigeria enters the official campaign season under the timetable set by the Independent National Electoral Commission (INEC), President Bola Ahmed Tinubu’s government is putting numbers at the centre of its economic case to voters.
In a detailed presentation of the administration’s reform scorecard, Finance Minister Prof. Taiwo Oyedele has sought to answer one of the most politically consequential questions surrounding the government’s economic programme: what happened to the money freed up by the reforms?
The government’s answer is a fiscal ledger spanning subsidy savings, additional revenue, borrowing, wages, debt service and infrastructure.
Its central argument is that the painful reforms introduced since 2023 did not simply create room in government accounts; they reshaped the distribution and deployment of public resources.
The figures also offer a window into the trade-offs confronting Africa’s most populous country. Higher revenues and reduced subsidies created fiscal space, but currency depreciation increased the naira cost of servicing external debt, while government spending rose sharply to absorb higher wages and fund infrastructure.
Here are the key numbers underpinning the administration’s Renewed Hope economic narrative.
₦15.8 trillion — Subsidy savings
Between June 2023 and December 2025, the removal of the petrol subsidy generated ₦15.8 trillion in savings for the Federation, according to the government.
The figure represents resources that were previously committed to subsidising fuel and were subsequently released into the Federation’s fiscal system.
₦5.4 trillion — Federal Government’s share
Of the ₦15.8 trillion in subsidy savings, ₦5.4 trillion accrued to the Federal Government.
The remaining ₦10.4 trillion went to states and local governments through the Federation’s revenue-sharing mechanism, underscoring the government’s argument that the fiscal benefits of subsidy removal were distributed beyond Abuja.
₦10.4 trillion — States and local governments
States and local governments received ₦10.4 trillion from the subsidy savings.
For the administration, this is a critical part of the reform story: subsidy removal did not merely strengthen the Federal Government’s balance sheet.
It also increased the pool of funds available to subnational governments, which are responsible for many frontline public services.
₦3.1 trillion — Incremental independent revenue
The Federal Government generated an additional ₦3.1 trillion in independent revenue, principally through increased remittances from government-owned entities.
That revenue formed another pillar of the government’s expanded fiscal capacity during the period.
₦11.9 trillion — Incremental borrowing
The Federal Government recorded ₦11.9 trillion in incremental borrowing.
The administration argues that the additional borrowing needs to be viewed alongside the fiscal reforms.
Its case is that without the savings and additional revenues created by the reforms, the government would have had to borrow significantly more to finance its obligations — potentially at greater economic cost.
₦20.4 trillion — Total incremental Federal resources
Taken together, the Federal Government’s share of subsidy savings, incremental independent revenue and incremental borrowing produced ₦20.4 trillion in additional Federal resources.
This is the central figure in the government’s fiscal narrative: the amount of additional resources it says became available as a consequence of the policy changes and financing measures.
₦30.64 trillion — Incremental expenditure
Those resources were deployed alongside the government’s existing revenue base to support ₦30.64 trillion in additional expenditure.
The gap between incremental resources and incremental expenditure highlights another feature of the administration’s argument: reform-era spending was not financed solely from subsidy savings.
Borrowing and other revenue sources remained important components of the fiscal equation.
₦9.39 trillion — Wages, minimum wage and allowances
The largest incremental spending category was ₦9.39 trillion for wage adjustments, the higher minimum wage and allowances for public servants.
The government stresses that this figure alone was substantially larger than the Federal Government’s entire ₦5.4 trillion share of subsidy savings.
That comparison is central to the administration’s claim that a significant portion of the fiscal gains from reform was channelled back into the economy through higher public-sector incomes.
₦9.37 trillion — External debt service
Almost as large was ₦9.37 trillion in external debt service.
The government attributes the increase in the naira cost of servicing foreign-currency debt largely to exchange-rate depreciation following the reform of the foreign-exchange regime.
The number also illustrates one of the unintended fiscal consequences of the reforms: while a weaker naira can improve certain aspects of external competitiveness, it sharply raises the domestic-currency cost of dollar-denominated obligations.
₦6.5 trillion — Strategic infrastructure
The government spent ₦6.5 trillion on strategic infrastructure, making it the third-largest incremental expenditure category.
The administration presents this spending as an investment in the productive capacity of the economy, alongside efforts to stabilise public finances and protect household incomes.
The bigger political calculation
The numbers form the backbone of President Tinubu’s emerging economic pitch as the political contest intensifies.
The administration’s message is straightforward: Nigeria took painful decisions, generated additional fiscal resources and redirected part of those resources towards wages, infrastructure and the financing of government obligations.
But the same figures also reveal the complexity of the reform gamble.
Subsidy removal generated substantial savings, yet inflation and the cost-of-living crisis have made the reforms politically difficult.
Higher government revenues have been accompanied by higher borrowing, while the naira’s depreciation has increased the burden of external debt service. At the same time, the government has had to spend heavily to cushion the impact of its policies.
The scorecard therefore does more than provide a list of numbers. It is an attempt to turn a politically difficult period of economic adjustment into a measurable story of fiscal transformation.
With the campaign season now opening, the contest will increasingly be over not just whether these reforms changed Nigeria’s finances, but whether voters believe the gains have reached their households.
By Charles Ike-Okoh
X-@theGBJournal|email:gbj@govbusinessjournal.com|govandbusinessj@gmail.com