


MON, JUNE 05 2023-theGBJournal |Nigeria’s total merchandize trade inched up slightly in Q1-2023, with total imports falling below exports resulting in a positive trade balance, according to the latest National Bureau of Statistics (NBS) report on foreign trade in goods statistics.
The report shows Nigeria’s total merchandise trade stood at N12,046.92 billion in Q1 2023, indicating an increase of 2.77% over the value recorded in Q4 2022 but declined by 17.47% when compared to the value
recorded in Q1 2022.
The disaggregation of total trade into exports and imports shows that total exports stood at N6,487.04 billion showing an increase of 2.00% over the value recorded in the preceding quarter and decreased by 8.66% over the corresponding period in the preceding year.
In addition, the data reveals that the share of exports in total trade stood at 53.85% in Q1, 2023.
Exports trade in the first quarter of 2023 was dominated by crude oil exports valued at N5,148.58 billion which accounted for 79.37% of total exports while non-crude oil exports value stood at N1,338.46 billion or 20.63% of total exports of which non-oil products contributed N652.29 billion representing 10.06% of total exports.
On the other hand, total imports were valued at N5,559.88 billion in Q1, 2023 indicating an
increase of 3.67% over the value recorded in the preceding quarter.
While the value fell by 25.83% over what was recorded in the corresponding period of 2022.
Imports trade share of total trade in the first quarter of 2022 accounted for 46.15% of total trade, bringing the trade balance to N927.16 billion in the period under review.
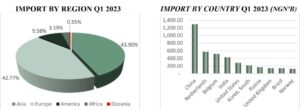
During the quarter under review, Nigeria imported goods mainly from Asia, valued at N2,440.91 billion or 43.90% of total imports.
This was followed by Europe with N2,378.17 billion or 42.77%, America with N532.55 billion or 9.58%, Africa with N177.50 billion or 3.19% and Oceania with N30.75 billion or 0.55%.
Imports from ECOWAS countries accounted for N42.30 billion, or 0.76% of the value of total imports.
By country of origin, imported goods originated mainly from China and were valued at N1,296.73 billion, representing 23.32% of total imports.
This was followed by The Netherlands with N575.23 billion (10.35% of total imports), Belgium with N518.12billion (9.32% of total imports), India with goods imported valued at N427.40 billion or 7.69% of total imports, and the United States of America with N283,94 billion (5.11% of total imports).
The NBS data shows that Nigeria exported most products to Europe with goods valued at N3,011.94billion or 46.43% of total exports, followed by exports to Asia valued at N1,612.21billion (24.85% of total exports), exports to America was valued at N1,193.02 billion, (18.39% of total exports) while export to other African countries stood at N665.90 billion or 10.27% of total exports of which N339.19 billion worth of goods were exported to ECOWAS countries.
The export destination during the quarter under review shows that The Netherlands recorded the highest value at N837.65 billion representing 12.19% of total exports.
This was followed by The United States of America with N579.35 billion or 8.93%, Spain with N488.17billion or 7.53%, France with N487.34 billion or 7.51%, and Indonesia with N456.69 billion or 7.04%.
These five countries collectively accounted for 43.92% of the value of total exports in Q1, 2023.
Twitter-@theGBJournal|Facebook-the Government and Business Journal|email:gbj@govbusinessjournal.com| govandbusinessj@gmail.com


