

…While the debt stock and its exchange-rate effects are important, the more relevant question for fiscal sustainability is the economy’s debt-carrying capacity and whether the government can service its debts.
By Dr. Shakirudeen Taiwo -Cordros Securities
WED OCT 07 2026-theGBJournal| Nigeria’s public debt rose by 4.7% (NGN7.51 trillion) to NGN166.79 trillion in H1-26.
The headline figure hides four structural shifts. First, deficit financing moved to short-term debt: Treasury bills now account for 22.4% (NGN19.48 trillion) of FGN domestic debt.
Second, commercial external borrowing has become secured, through the first USD1.50 billion draw from the USD5.00 billion total return swap.
Third, Ways and Means financing has begun to decline (from NGN22.72 trillion to NGN21.11 trillion), and, lastly, sub-national borrowing (up 11.94%) is growing faster than Federal Government debt (up 4.10%).
In our analysis, we observed that the naira’s strength has masked the pace of borrowing.
For year-end 2026, we expect exchange rate and interest rate movements to remain important determinants of the country’s debt stock, alongside underlying borrowing requirements.
Nigeria’s Public Debt Stock: Flat in Q1-26, sharply higher in Q2-26
Nigeria entered the second half of 2026 with its strongest external position in almost two decades, while the public debt stock appears relatively stable in naira terms.
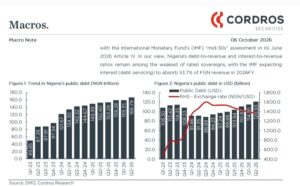
According to the latest public debt report from the Debt Management Office, Nigeria’s total public debt reached NGN166.79 trillion as of June 2026, up NGN7.51 trillion (4.7%) from NGN159.28 trillion at the end of 2025, with 99.0% of the increase in H1-26 occurring in Q2-26.
The quarterly profile of the naira debt stock could be misleading if only the headline figures are considered.
In Q1-26, the public debt rose by only 0.1% q/q to NGN159.35 trillion (Q4-25: NGN159.28 trillion), but that was because the naira strengthened from NGN1,435/USD to NGN1,386/USD over the quarter, cutting the naira value of external debt by NGN2.54 trillion and masking NGN2.55 trillion of new domestic borrowing.
In Q2-26, with less currency movement, the underlying borrowing showed through: the public debt stock rose by 4.7% q/q (NGN7.44 trillion) to NGN166.79 trillion.
In dollar terms, the picture is steadier: public debt rose by 9.0% to USD120.93 billion (Q4-25: USD120.93 billion), adding USD3.98 billion in Q1-26 and USD5.98 billion in Q2-26. The gap between the two measures is the exchange rate impact.
While the debt stock and its exchange-rate effects are important, the more relevant question for fiscal sustainability is the economy’s debt-carrying capacity and whether the government can service its debts.
Ratio analysis, therefore, provides an important complement to the headline debt figures. After the 2024 GDP rebasing, the country’s debt ratios look modest by frontier-market standards: total public debt is about 34.0% of GDP as of June 2026, consistent with the International Monetary Fund’s (IMF) “mid-30s” assessment in its June 2026 Article IV. In our view, Nigeria’s debt-to-revenue and interest-to-revenue ratios remain among the weakest of rated sovereigns, with the IMF expecting interest (debt servicing) to absorb 53.7% of FGN revenue in 2026FY.
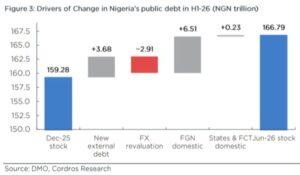
Decomposing the NGN7.51 trillion increase: The change in the total debt stock was driven primarily by FGN domestic borrowing of NGN6.51 trillion, followed by new net external borrowing of NGN3.68 trillion, valued at the 30 June exchange rate (NGN1,379.18/USD).
The FX revaluation of the opening external debt stock reduced the naira value of debt by NGN2.91 trillion, while States and the FCT added a further NGN230.00 billion through domestic borrowing.
External Debt: Greater reliance on commercial financing
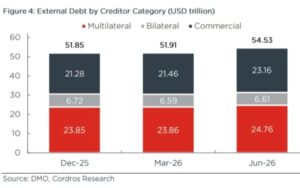
External debt rose by USD2.67 billion (5.1%) to USD54.53 billion as of H1-26, from USD51.85 billion as of December 2025.
The composition of that increase is more important than its size. Commercial lenders accounted for 70.1% of the increase, and multilateral and bilateral financing contributed for about 30.0%.
Bilateral debt declined by USD118.00 million, reflecting the scheduled amortisation of Exim Bank of China loans. The commercial share of external debt rose from 41.0% to 42.5%, while the non-commercial share declined to 57.5% by the end of H1-26.
Eurobonds were unchanged at USD18.55 billion, equivalent to 34.0% of external debt, with no issuance or redemption during H1-26.
In our view, the gradual shift towards commercial external funding could increase interest costs, refinancing risks and dependence on market access.
Compared with listed Eurobonds, these commercial facilities generally provide less publicly available information on pricing and contractual terms, and the absence of an actively traded secondary market limits the availability of market-based price signals about their credit risk.
With FX reserves at USD55.0 billion, equivalent to roughly 3.0x the outstanding Eurobond stock, we view the shift as a gradual deterioration in external credit quality rather than an immediate solvency concern. However, reserve coverage alone does not eliminate broader external-liquidity risk.
Key Lenders and Repayments: In H1-26, five lenders accounted for most of the increase in external debt.
The USD1.5 billion Total Return Swap (TRS) with First Abu Dhabi Bank, first recorded in June, represents the largest single addition to the external debt stock.
The World Bank remained the largest multilateral source, adding a net USD838.00 million through the International Development Association (IDA) (USD616.00 million) and the International Bank for Reconstruction and Development (IBRD) (USD222.00 million).
Syndicated commercial loans increased by USD380.00 million (+14.2%), including increases of about USD198.00 million in Afreximbank and FAB syndications and USD156.00 million in UniCredit facilities. Exim Bank of China’s outstanding exposure, meanwhile, declined by USD152.00 million due to scheduled amortisation.
Domestic Debt: The maturity profile is shortening
In H1-26, FGN domestic debt increased by 8.1% (NGN6.51 trillion) to NGN87.00 trillion. Treasury bills accounted for NGN5.63 trillion (86.0% of the increase), taking the T-bills stock from NGN13.85 trillion to NGN19.48 trillion, equivalent to 22.4% of FGN domestic debt.
FGN naira bonds added NGN1.87 trillion during the same period. Three items partly offset these increases: securitised Ways and Means fell by NGN613.00 billion, naira and FX Promissory Notes worth NGN329.00 billion were redeemed, and the naira value of the domestic USD-bond fell by NGN51.00 billion as the exchange rate strengthened.
The securitised Ways and Means balance — the NGN22.70 trillion CBN overdraft converted into a 40-year instrument in 2023 — fell by NGN613.00 billion in Q2-26, its first reduction during the review period. Its share of FGN domestic debt consequently declined to 25.4%.
The reduction is modest but significant, as it provides evidence of progress in reducing the stock of monetary financing rather than adding to it. In our view, a published amortisation schedule would make the repayment credible, showing that the reduction is part of a sustained programme rather than a one-off adjustment
Why the shift to treasury bills matters: The composition of domestic debt matters as much as its size. With T-bills now more than a fifth of the domestic debt stock, a large share of the FGN debt must be rolled over every 91–364 days. Each auction, therefore, resets part of the interest bill to prevailing market yields.
The refinancing burden was significant in H1-26, when 364-day stop rates were around 17.0–18.0%; Treasury bills accounted for NGN1.49 trillion of interest payments, or about 30.0% of domestic interest costs.
The refinancing burden should ease in the coming quarters as maturing bills are rolled over at lower stop rates, which have fallen to 15.5–15.9% since the September 2026 MPC meeting.
However, the shorter maturity profile creates two-way interest-rate exposure: a reversal in the easing cycle would feed into the budget relatively quickly and maturing bills are refinanced at higher yields.
The trend did not reverse in Q3-26. The CBN allotted NGN8.14 trillion of bills across eight Q3-26 auctions, about 40.0% above the NGN5.8 trillion target, against projected maturities of NGN2.64 trillion.
We calculated net bill issuance of about NGN5.5 trillion in Q3-26 (NGN8.14 trillion allotted, less NGN2.64 trillion maturing), lifting the T-bill stock to about NGN25.00 trillion by end-September, roughly 27.0% of FGN domestic debt.
The overshoot partly reflects strong demand for 364-day paper — NGN4.09 trillion of bids for NGN400.00 billion offered on 23 September — alongside liquidity-management considerations.
Nevertheless, the issuance pattern indicates that a greater share of deficit financing is being sourced from the short end than envisaged in the original borrowing plan.
Debt service and affordability: The key fiscal constraint
Total debt service amounted to about NGN7.8 trillion in H1-26, with external debt service converted into naira at quarter-end exchange rates.
Domestic debt service amounted to NGN5.28 trillion, comprising NGN3.14 trillion in Q1-26 and NGN2.14 trillion in Q2-26. Q1 service was elevated by FGN bond coupons and a large March Treasury bill maturity.
External debt service totalled USD1.82 billion, including USD954 million in Q1-26 — of which USD428 million comprised Eurobond coupons — and USD871 million in Q2-26. On a naira-converted basis, around 68% of total debt service was domestic.
Interest accounted for 94% of domestic debt service, at NGN4.95 trillion, and 61% of external debt service. Within domestic interest payments, FGN bonds accounted for NGN3.29 trillion and Treasury bills for NGN1.49 trillion.
On the external side, Eurobond coupons accounted for USD645.00 million, while multilateral and bilateral debt service amounted to USD676.00 million and USD321.00 million, respectively.
Annualised H1-26 debt service of about NGN15.60 trillion is broadly in line with the NGN15.80 trillion provision in the 2026 budget. The lower-than-budgeted run rate partly reflects the stronger naira, which reduces the naira cost of servicing foreign-currency debt.
Average cost vs marginal cost: Dividing annualised H1 interest payments by the average opening and closing debt stocks implies an average interest cost of about 11.8% on FGN domestic debt, compared with 4.2% on external debt.
The gap is wider at the margin: new domestic funding costs 15.5–16.9% (364-day bills to 10-year bonds), while Nigeria’s Eurobonds trade at a size-weighted yield of about 7.2%.
Even after allowing for expected exchange-rate depreciation, the differential helps explain the continued attractiveness of external funding relative to higher-cost domestic borrowing.
This makes the domestic rate cut valuable. A 100bps fall in T-bill yields would save about NGN195.00 billion (USD141.39 million) on the June 2026 T-bill stock when it rolls over, with further savings as higher-cost bonds mature.
Off-balance-sheet risks: The DMO reports NGN7.84 trillion in guarantees and contingent liabilities as of 30 June 2026, equivalent to 4.7% of public debt.
The available data cover June only, so changes over H1-26 cannot be assessed. However, the composition is important: the two largest categories relate to the TRS collateral and the power sector.
TRS collateral (NGN2.74 trillion, 35.0%) — FGN May-2032 bonds pledged against the USD1.5 billion swap. Further drawdowns could increase the associated collateral requirement, subject to the facility’s terms.
Power sector (NGN2.71 trillion, 34.5%) — put-call option agreements, partial risk guarantees and the NBET bond. These exposures are ongoing rather than purely one-off, with tariff shortfalls and legacy liabilities creating continuing fiscal risks where government guarantees or support obligations are triggered.
The remaining exposures comprise the BOI Eurobond and Lekki Port (NGN1.98 trillion, 25.3%), pension arrears (NGN375 billion) and housing finance (NGN31 billion).
Sub-national debt: growing faster than the centre: States and the FCT’s total debt rose by 11.9% to NGN14.01 trillion, while the external debt component increased by 20.2% to USD6.83 billion.
Two features warrant attention. First, sub-national external debt is largely concessional but is serviced through deductions from Federation Account allocations, reducing the resources available to fund recurrent and capital expenditure at the state level.
Second, the increase in borrowing is occurring alongside stronger state revenues following the removal of the fuel subsidy, FX-market reforms and higher oil receipts.
Similar revenue windfalls have historically preceded surges in sub-national borrowing, particularly ahead of elections. Investors in state bonds and lenders to state governments should closely monitor debt-service deductions from FAAC allocations.
Sensitivities and Scenarios for Year-end 2026
The sensitivity analysis is anchored on two key variables: the exchange rate and interest rates.
Our analysis indicates that the end-2026 public debt stock is particularly sensitive to exchange-rate and interest-rate movements, alongside the underlying borrowing requirement.
Exchange rate is the biggest swing factor: About 45.0% of public debt (USD 54.52 billion) is in foreign currency. So, each 1.0% move in naira (about NGN13.80/USD at the 30 June rate of NGN1,379.00/USD) changes the debt stock by roughly NGN750.00 billion, or 0.45% of total public debt. Depreciation raises the debt stock, and appreciation lowers it.
Holding June 2026 stock constant, the late-September rate of NGN1,321.00/USD would lower the public debt stock by about NGN3.10 trillion, to NGN163.60 trillion.
A depreciation to NGN1,550.00/USD would increase the debt stock by an estimated NGN9.30 trillion, to around NGN176.10 trillion, while a move to NGN1,700.00/USD would increase it by approximately NGN17.50 trillion.
Foreign-currency debt service is similarly exposed: based on H1-26 external debt service, each NGN50.00/USD depreciation adds about NGN91.00 billion to the naira cost per half-year (about NGN180.0 billion a year).
Interest rate sensitivity: The shift toward bills makes the budget more sensitive to monetary policy. On the June T-bill stock of NGN19.50 trillion, a 100bps change in refinancing yields implies an annualised interest-cost sensitivity of about NGN195.00 billion.
On our estimated end-September stock of NGN25.00 trillion, the equivalent sensitivity rises to about NGN250.00 billion once the stock is fully refinanced.
The 364-day stop rates have fallen about 180bps from their July peak, helped by the September MPR cut, implying annualised interest savings of roughly NGN0.35–0.45 trillion as the existing stock is refinanced at lower yields.
The sensitivity is symmetric: if inflation or FX shocks prompt the CBN to pause or reverse its easing cycle, refinancing costs would rise as maturing bills are rolled over at higher yields.
Dr. Shakirudeen Taiwo|shakirudeen.taiwo@cordros.com
X-@theGBJournal|email:gbj@govbusinessjournal.com|govandbusinessj@gmail.com